The years following the Covid-19 pandemic have been characterised by a significant surge in inflation worldwide. In Spain, the focal point of this post, the interannual inflation rate periodically exceeded 10%, a level unseen since the 1970s. Currently, inflation appears to be stabilising across OECD countries, with most economies approaching more acceptable rates around 3%.
Inflation acts as a regressive economic burden, disproportionately affecting lower-income populations. While a 10% increase in steak prices might be a minor inconvenience for middle-class households, it can represent a substantial financial strain for workers struggling to make ends meet.
This post aims to explore the multifaceted impacts of inflation in Spain, with a particular focus on its effects on wages and housing markets.
Average Inflation in Spain
The evolution of inflation in Spain since 2016 appears below:
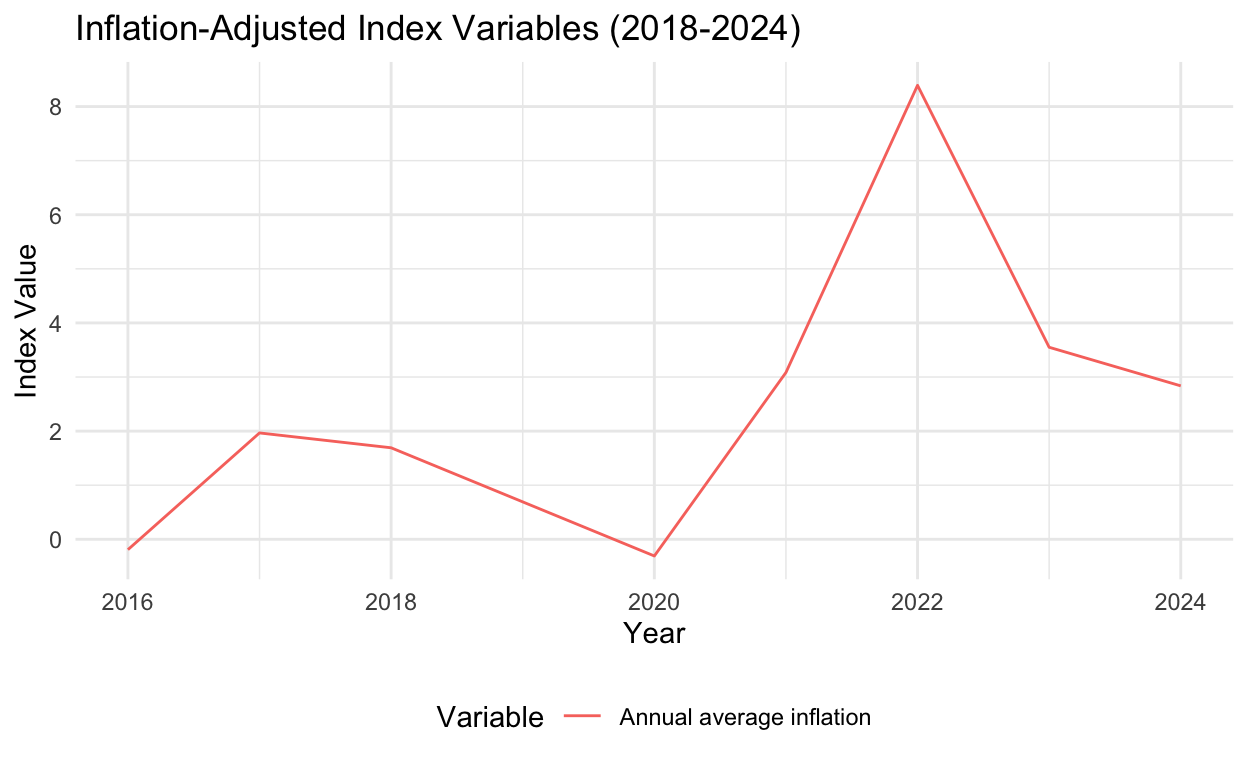
The figure clearly shows the 2021-2023 inflationary period. Inflation affects most commodities, including labour, but it is unlikely that it affects all commodities equally. The most important question is whether workers kept their purchasing power throughout the period. We can answer that question by looking at the evolution of real wages. To this end, we gathered data from the National Institute of Statistics (INE in Spanish). The INE provides nominal data. We adjust all figures to 2024 prices using the inflation rates. Here’s how it works:
We start by setting a deflator of 1 for 2024, meaning 2024 values remain unchanged. To adjust for 2023 prices, we use the 2024 inflation rate (2.81%) and calculate the deflator as 1 / (1 + 0.0281) ≈ 0.97. This means 2023 figures are divided by 0.97 to align with 2024 prices. For 2022, we account for 2023 inflation (3.55%) by dividing the 2023 deflator (0.97) by 1 + 0.0355, and so on. This step-by-step adjustment accounts for the compounding effect of inflation over time.
We complemented the INE data with data on average wages collected by the OECD. These data suggest a slightly higher average wage, but as we will see below, the evolution of both variables is virtually identical. The advantage of the OECD data is that it reaches 2023 (at the time of writing, end of 2024, INE data for 2022 are not available).
Rather than just focusing on wages, we are also going to include two additional quantities: average rental (in euros per square metre) and the average house prices (in euros per square metre). The idea here is to see if housing has become more or less affordable. These data are obtained from idealista.es, and you can access them here. The data from the INE is here, whereas the OECD data are here
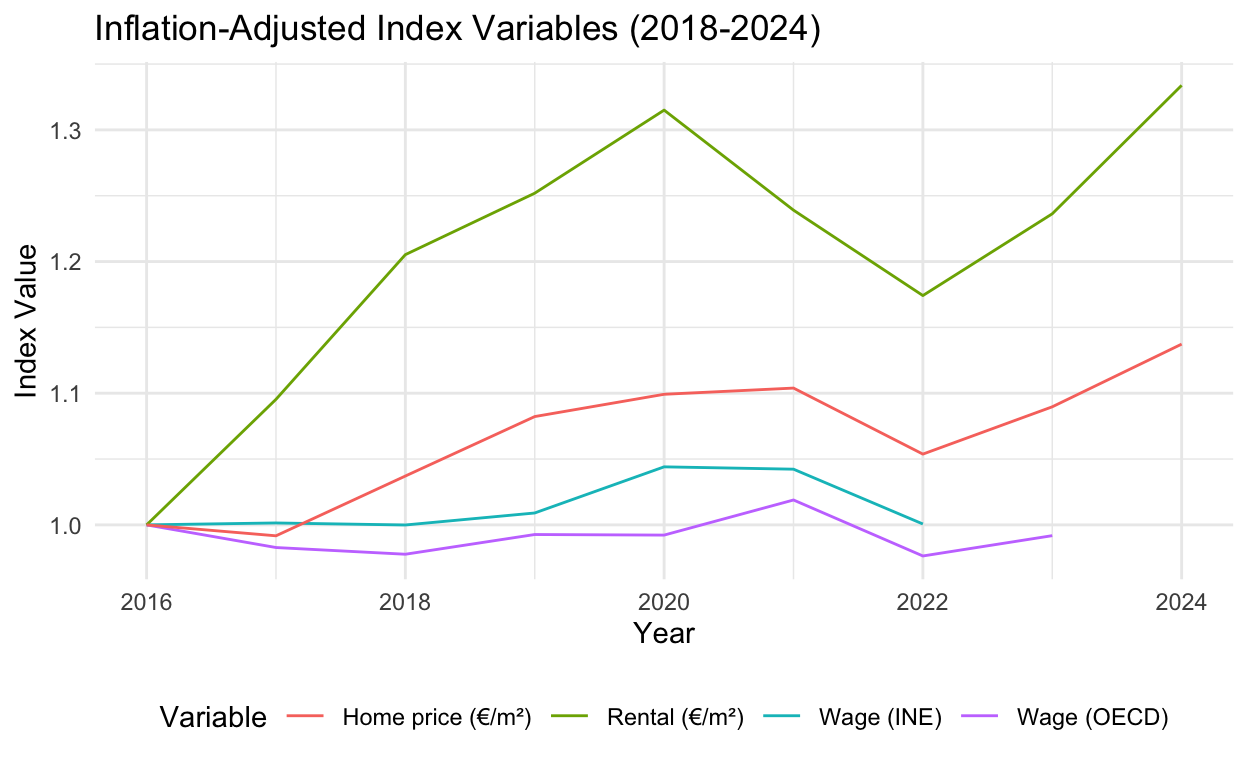
The figure reveals, immediately, two facts. First, real wages have stayed flat since at least 2016; second, housing has become increasingly more expensive, particularly rentals. In 2023, for example, OECD data suggests that wages were just below the 2016 level; however, 1 square metre was almost 10% more expensive than in 2016. Rentals were almost 25% more expensive. The corollary of this is evident.
NOTE: It is important to remark here that the average salary is substantially larger than the median salary, as the distribution of income is heavily skewed—in Spain and elsewhere. Therefore, the situation is likely to be more dramatic than the figure reveals.
The increase in rental prices is somewhat unsurprising, given that the supply of rental places has dropped 33% since 2019 and 2024 (source). In Barcelona, the drop has been 75% (followed, at a long distance, by Oviedo and San Sebastián, where supply dropped by 55% in the same period).
Now, some activists are arguing that this is due to the number of short-term holiday rentals, which has doubled in the country. In essence, people are claiming that houses previously used for long-term rentals are now being used for Airbnb. However, as the next figure shows, the relationship between the two types of rentals is tenuous at best. In the figure, we removed two outliers (Huesca and Jaén), where, according to the data, permanent rentals increased over five times more than in the next capital city, Lugo, at 13%.
We can assess this correlation more formaly with a simple regresssion line:
Call:
lm(formula = filtered_data$AlquilerPermanente ~ filtered_data$AlquilerTemporada)

Residuals:
    Min      1Q  Median      3Q     Max
-48.881 -14.108  -2.789  13.981  41.146

Coefficients:
                                  Estimate Std. Error t value
(Intercept)                     -28.145996   3.996522  -7.043
filtered_data$AlquilerTemporada   0.008308   0.007800   1.065
                                Pr(>|t|)
(Intercept)                     6.33e-09 ***
filtered_data$AlquilerTemporada    0.292
---
Signif. codes:  0 '***' 0.001 '**' 0.01 '*' 0.05 '.' 0.1 ' ' 1

Residual standard error: 19.04 on 48 degrees of freedom
Multiple R-squared:  0.02309,   Adjusted R-squared:  0.002741
F-statistic: 1.135 on 1 and 48 DF,  p-value: 0.2921
With a slope coefficient of essentially 0, we cannot attribute holiday rentals any significant role in the drop in permanent rentals. If we want to understand why rental prices have risen so dramatically, we need to look elsewhere. Indeed, in the UK, for example, according to USwitch (here), 10% of homes in England were privately rented in 2000, but by 2023, this figure had risen to 18.8% (or 4.6 million houses).
According to The Guardian, however, between April 2016 and May 2019, the number of active listings on Airbnb in the UK tripled, from about 76,000 to more than 225,000. Since then, the number has increased by a further 14%, reaching 257,000 in January 2020 (full report here). Thus, in the UK, it seems that Airbnb has not significantly affected long-term rentals either.
Property rights, right?
What could explain the very substantive drop in rentals in Spain? The reasons are likely to be complex, but property owners might be finding it difficult to cope with the lack of legal protection against difficult tenants (particularly those avoiding rent payments) and the government’s increasing restrictions on the nature of rentals, which include legal minimum terms, compulsory extensions of contracts, and, in some regions, price controls.
The lack of protection faced by homeowners is well illustrated by existing trends in squatting (okupación, in Spanish).
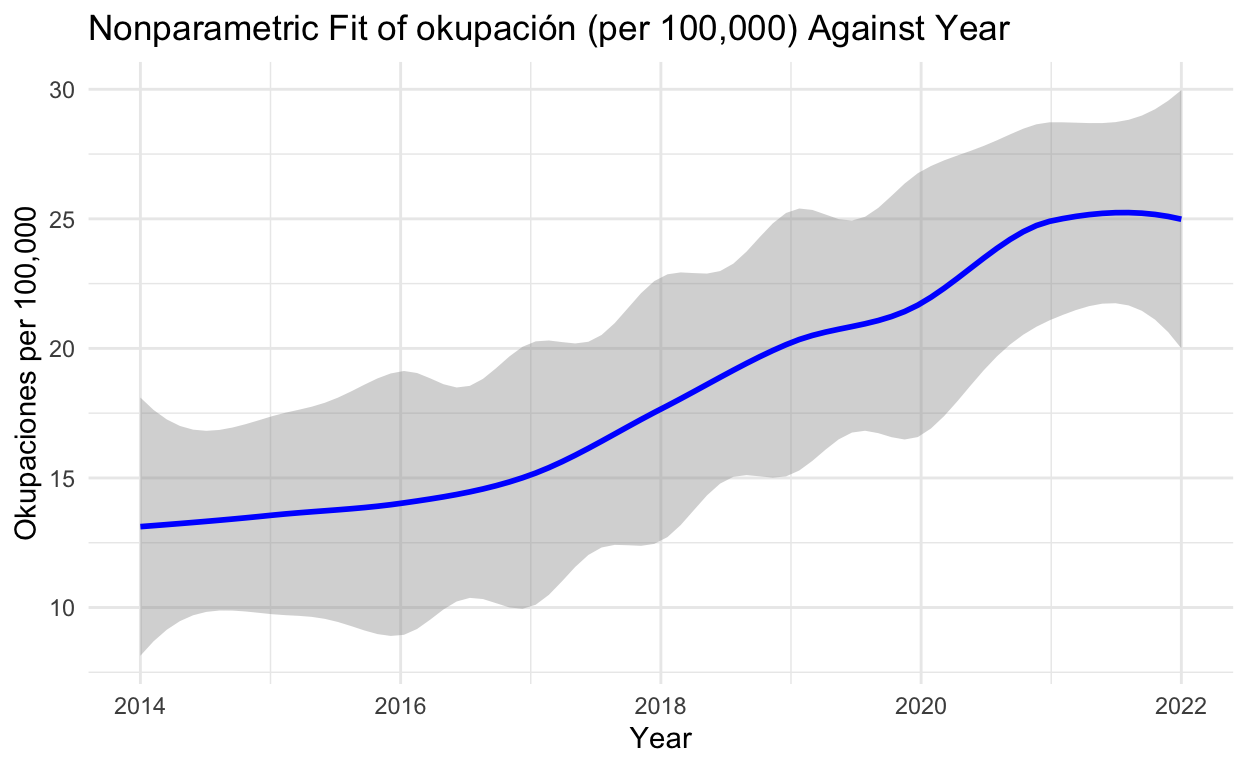
The first figure illustrates a nonparametric fit of okupación rates (squatting incidents per 100,000 people) in Spain over time, from 2014 to 2022. The trendline clearly shows a steady increase in the number of okupaciones during this period, with rates nearly doubling from about 12 per 100,000 in 2014 to over 25 per 100,000 by 2022. The shaded area represents the confidence interval, indicating the range of uncertainty around the fit. This upward trajectory highlights a growing trend of squatting, which may reflect underlying challenges in housing security, enforcement, or the rental market.
The second figure shows a scatter plot comparing the rate of okupaciones per 100,000 people with changes in permanent rental availability (denoted as “Alquiler Permanente”). There is no strong visible relationship between these two variables, as the points are widely dispersed across the axes. This suggests that the rise in okupación rates is not directly correlated with fluctuations in permanent rental availability, pointing to the possibility that other factors—such as legal frameworks, economic conditions, or social pressures—may be driving the increase in squatting activity.
Nonetheless, we do find some correlations that are worth replicating here. The following regressions include two dummy variables. dummy1 takes value 1 if the data comes from a Catalan province. dummy2 takes value 1 if the data refers to one of the five largest cities in Spain (Madrid, Barcelona, Bilbao, Sevilla and Málaga).
Call:
lm_robust(formula = alquilerpermanente ~ alquilertemporada +
    okp100000 + dummy_1 + dummy_2, data = data_2021)

Standard error type:  HC2

Coefficients:
                  Estimate Std. Error t value Pr(>|t|)  CI Lower
(Intercept)       -22.6761     5.9118  -3.836 0.000372 -34.56903
alquilertemporada   0.0253     0.0081   3.123 0.003059   0.00901
okp100000          -0.2387     0.1664  -1.434 0.158191  -0.57353
dummy_1            -7.5347    16.8220  -0.448 0.656277 -41.37630
dummy_2           -20.3752     4.2022  -4.849 0.000014 -28.82884
                  CI Upper DF
(Intercept)       -10.7831 47
alquilertemporada   0.0416 47
okp100000           0.0962 47
dummy_1            26.3068 47
dummy_2           -11.9215 47

Multiple R-squared:  0.304 ,    Adjusted R-squared:  0.245
F-statistic: 10.4 on 4 and 47 DF,  p-value: 0.00000402
The first regression above indicates that the change in permanent rentals between 2019 and 2024 was positively associated with the increase in short-term/holiday rentals. Additionally, the five largest cities experienced an average decrease in rentals of 20 percentage points, which was larger than the overall average. Occupation levels were not statistically significant in explaining the observed changes.
Call:
lm_robust(formula = alquilertemporada ~ okp100000 + alquilerpermanente +
    dummy_1 + dummy_2, data = data_2021)

Standard error type:  HC2

Coefficients:
                   Estimate Std. Error t value Pr(>|t|) CI Lower
(Intercept)          489.83     147.11  3.3296   0.0017   193.87
okp100000              3.38       3.97  0.8506   0.3993    -4.61
alquilerpermanente     7.44       4.28  1.7366   0.0890    -1.18
dummy_1               14.39     447.88  0.0321   0.9745  -886.63
dummy_2               -3.70     106.00 -0.0350   0.9723  -216.94
                   CI Upper DF
(Intercept)           785.8 47
okp100000              11.4 47
alquilerpermanente     16.1 47
dummy_1               915.4 47
dummy_2               209.5 47

Multiple R-squared:  0.203 ,    Adjusted R-squared:  0.135
F-statistic: 1.67 on 4 and 47 DF,  p-value: 0.174
The second regression above reveals that holiday/short-term rentals varied primarily with the number of long-term rentals and in the same direction, regardless of location. Notably, both regressions exhibit relatively high \(R^2\) values, which is uncommon in practice.
Call:
lm_robust(formula = okp100000 ~ alquilertemporada + alquilerpermanente +
    dummy_1 + dummy_2, data = data_2021)

Standard error type:  HC2

Coefficients:
                   Estimate Std. Error t value  Pr(>|t|) CI Lower
(Intercept)        16.87369    3.68491   4.579 0.0000344   9.4606
alquilertemporada   0.00423    0.00529   0.800 0.4277797  -0.0064
alquilerpermanente -0.08785    0.08797  -0.999 0.3230957  -0.2648
dummy_1            65.81125   15.49927   4.246 0.0001018  34.6307
dummy_2             4.68431    6.32589   0.740 0.4626811  -8.0417
                   CI Upper DF
(Intercept)         24.2868 47
alquilertemporada    0.0149 47
alquilerpermanente   0.0891 47
dummy_1             96.9918 47
dummy_2             17.4104 47

Multiple R-squared:  0.627 ,    Adjusted R-squared:  0.596
F-statistic: 11.4 on 4 and 47 DF,  p-value: 0.00000147
The thrid regression is also clear. Among the predictors, dummy1 (indicating Catalan data) has the strongest and most statistically significant effect on okupations: 65 cases per 100,000 more than the average. The other variables (the change in alquiler de temporada and alquiler permanente, and dummy_2) do not show significant effects in this model. The \(R^2\) is 0.59, which is extremely high.
So what?
The above preliminary analysis reveals the intricate interplay between inflation, wages, housing affordability, and property rights in Spain, particularly in the post-pandemic period. While inflation has stabilized in recent years, its ripple effects have disproportionately burdened lower-income populations, with stagnant real wages and surging housing costs deepening economic inequality. The housing crisis, marked by skyrocketing rental prices and reduced supply, cannot be solely attributed to the rise of short-term holiday rentals like Airbnb. Instead, structural issues, including legal protections for landlords and the broader regulatory framework, play a critical role.
The steady increase in squatting incidents (okupaciones) highlights further complexities within the housing market, underscoring vulnerabilities in property rights and enforcement. Although correlations with rental availability and location-specific factors provide some insights, the lack of a strong causal relationship suggests that broader systemic challenges need to be addressed.
It came rather clear, however, that Cataluña is experience a sort of rental nightmare, with an extraordinary drop in the supply of long term rentals. This is more to do with local politics. The Catalan local government (supported by the socialist Spanish government) introduced rent controls which “seemingly” stopped price hikes. In reality, these controls produced the expected results. First, supply or long term rental has collapsed as we’ve seen above. Second, though variation in prices of existing contracts was close to negligible, the “asking” price of rentals increase by 16% since the introduction of controls. You can read more about this here.
Finally, it is worth pointing out a few facts. Data from Eurostat here shows that Spain had, in 2021, the 7th largest average age of young people leaving the parental household, at 30.2 years. The same figure in 2017 was 29.3. In comparison, the average parental household leaving age in the European Union was 26 years (with a minimum of 21, in Finland). Stagnant wages, high rentals, legal insecurity… These seem expensive treats for a nation with an official figure for youth unemployment of 26%.