I once owned a charming blue 2010 Toyota Auris, acquired in 2012 for a tidy £7,000 with just 25,000 miles on the clock. Little did I know this seemingly perfect machine harboured a dark secret – a sneaky oil leak. Fast forward to 2022, and with just 90,000 miles under its belt, the engine staged a Shakespearean tragedy. One cylinder quit entirely, another limped at 25%, while two struggled at 50% each. It all came to a halt on a gloomy Friday morning on Manchester’s infamous M60 ring road. Farewell, faithful Auris.
But every ending heralds a new beginning, right? Enter: the quest for a new car. Unfortunately, 2022 was one of the worst times in history to buy a second-hand car. Prices had shot through the roof, as seen in the graph below, which tracks second-hand car prices in the UK since 1988. January 2015 is the base year (index = 100).
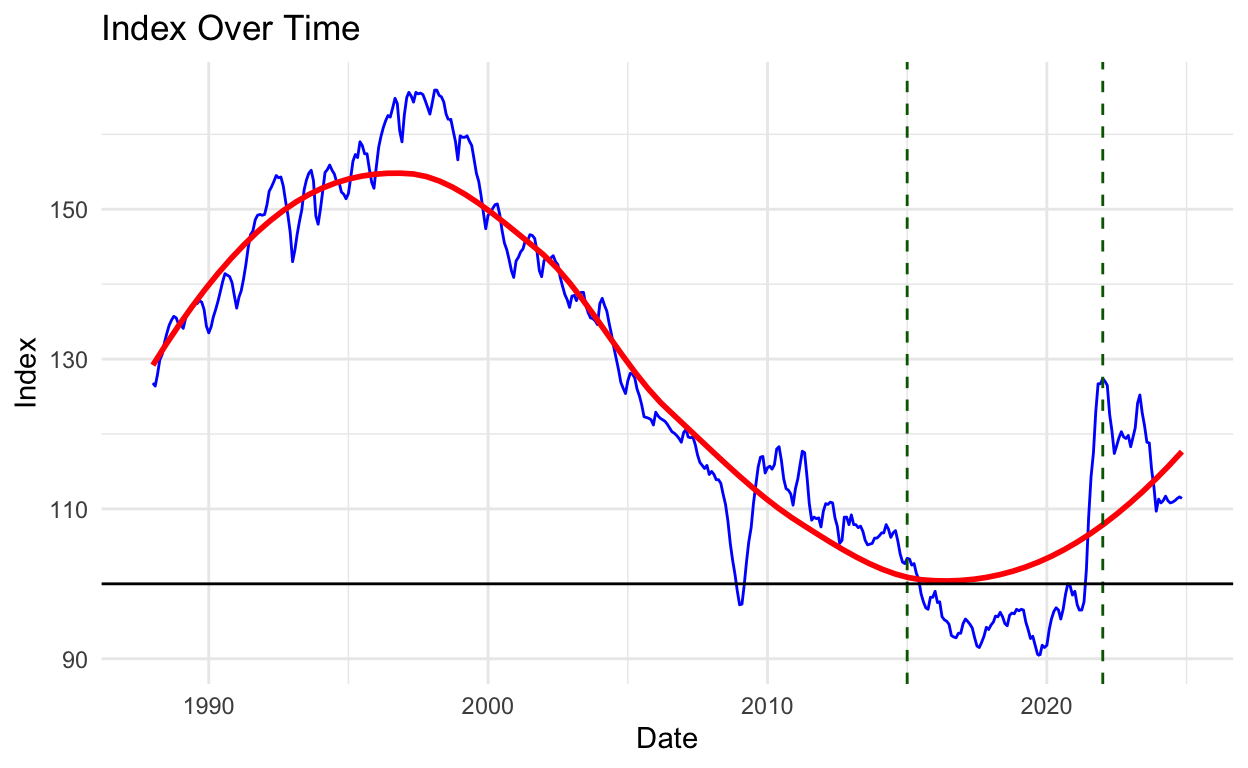
As you can see, January 2022 marked a historic peak in second-hand car prices. With new cars in short supply, the second-hand market turned into a frenzy. For someone looking for a reasonably priced car, it was a disheartening time.
Fishing for Bargains: The Mazda Hunt Begins
So, how do you find a good deal in this chaotic market? By using data, of course! My goal was to build a predictive model to estimate second-hand car prices based on attributes like mileage, engine specs, age, and more. This way, I could identify cars priced below their predicted values – true bargains.
First, I needed data. I turned to the UK’s go-to site for second-hand cars: Autotrader. However, the site doesn’t allow direct downloads of its data. So, like any good data enthusiast, I wrote a crawler.
The Crawler Chronicles
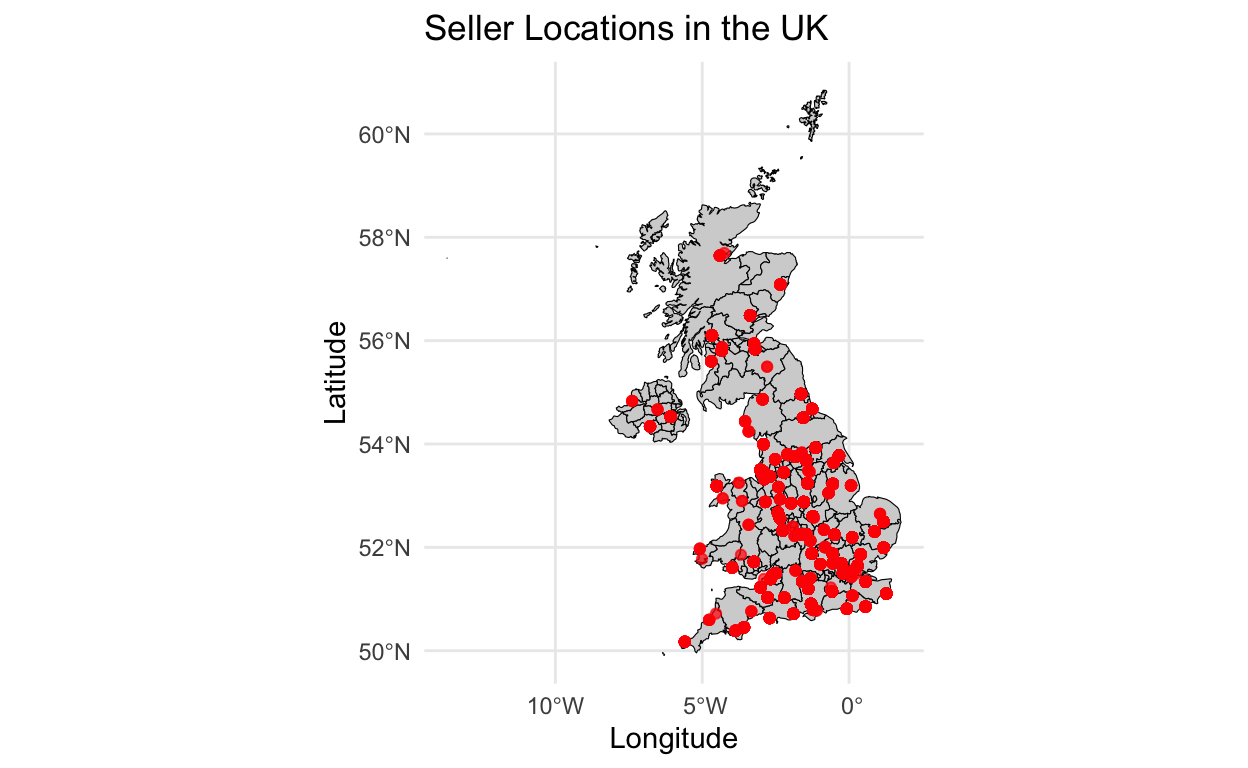
My crawler carefully navigated Autotrader’s pages, scraping details about each car – registration year, mileage, power, engine size, and so on. To avoid detection, I slowed down requests, used randomised UK postcodes, and removed duplicates. After focusing on Mazda cars, I collected data on 7,480 unique vehicles. The result was a geographically representative dataset, as illustrated below:
Growing the Random Forest

Figure 1: A random forest, á la Salvador Dalí.
To predict prices, I trained a random forest model. Here’s the process:
- Split the dataset into training (80%) and test (20%) sets.
- Train a random forest with 500 trees using the training data.
- Evaluate the model using the test data.
The results are below.
Random Forest Summary:Number of Trees: 500 Mean of Squared Residuals: 1854734 Variance Explained: 95.93254 %For those of us working in the social sciences, models are those things that explain 10% of the outcome, the necessary evil, the stuff we teach students (because of arcane conventions). The model explained 95% of the variance in car prices – an impressive feat!
Forests and trees have the disadvantage of not yielding “coefficient estimates”, so we cannot readily assess the contribution of each predictor to the price of a car. For random forests, however, we can create a variable importance plot, as follows:
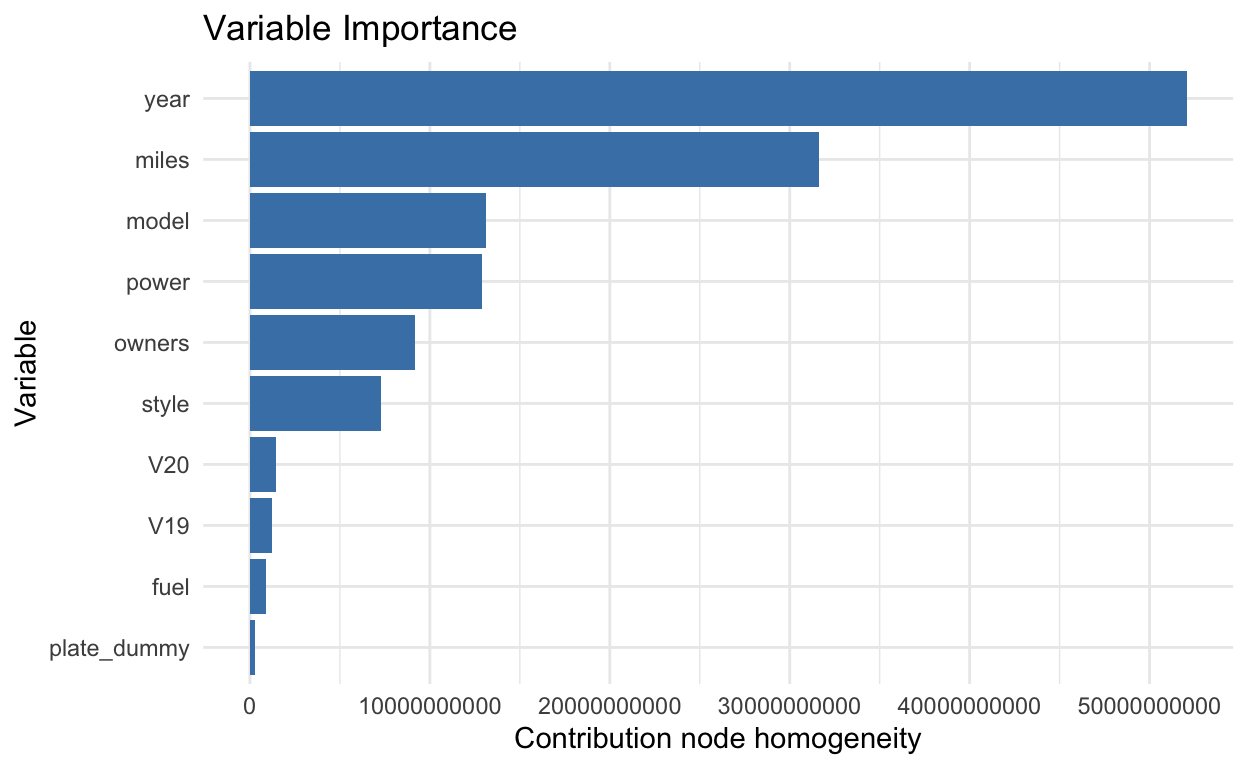
The length of each bar measures each variable’s contribution to the similarity (purity) of each node (our goal with the forest is to minimise the inequality within nodes). We can readily see that the results are plausible: age and mileage are the principal variables, followed by the type of model and the power of the engine. Interestingly, the number of previous owners plays a relatively minor role in explaining the price of a car (even though a car with many owners might signal trouble ahead). The location of the dealer does not seem to explain much, but it does explain more than the type of fuel, which is surprising. In the UK, car plates include information about the registration year. A two-digit number in the middle of the plate tells us the year. For example, my previous car had a registration that looked like:

Figure 2: Registration Type 1.
The “10” in the middle indicates that the car was first registered in 2010. However, there’s also a second type of registration format where the registration year is represented by adding 50 to the actual year, such as…

Figure 3: Registration Type 2.
I’ve heard a few times that the 60 version is preferred by drivers, which should reflect in the price. As you can see above, the type of registration does not bear much weight on car prices (“plate_dummy” equals 1 if the registration is in the 60 format).
Predicted vs Real Values
Finally, to assess the model’s accuracy, I plotted the predicted prices against the actual prices for the test data:
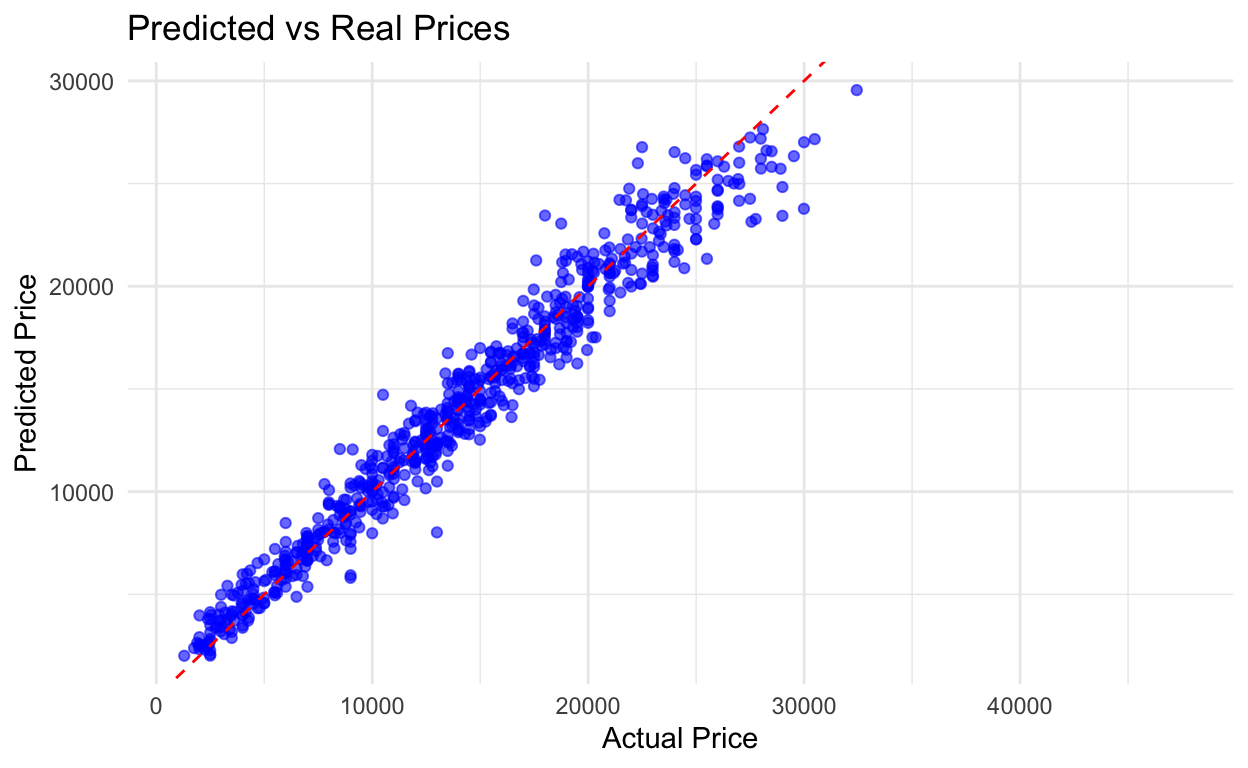
With a 95% accuracy, you want to buy the cars that fall below the red line. Those are the real bargains…
Conclusion: The Fruits of the Forest
Through the power of data and a trusty random forest model, I managed to navigate the wild world of second-hand car prices. While not perfect, the model provided valuable insights into price determinants, with mileage and age being the top influencers. Armed with this tool, I could confidently identify bargains and avoid overpriced lemons.
So, if you’re fishing for Mazdas or any other car, don’t just rely on luck. Use data, embrace the power of models, and let the numbers guide you to the best deal!